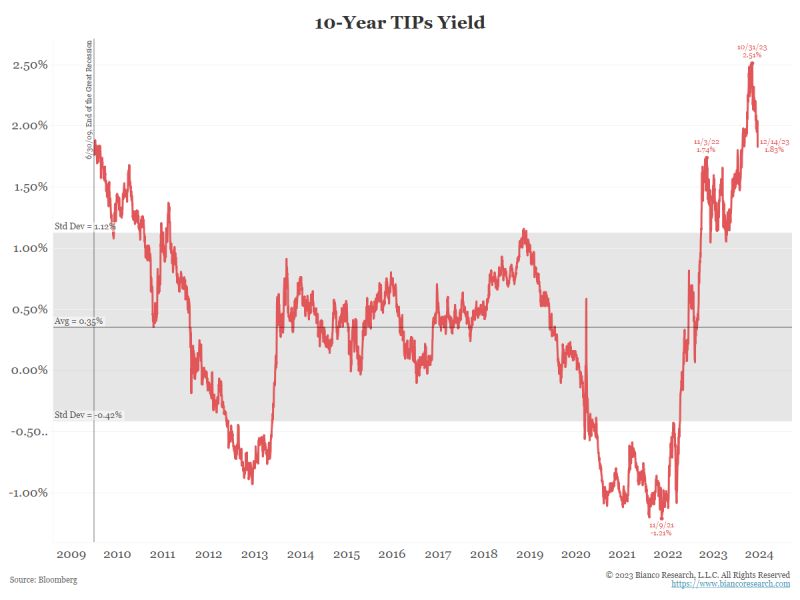
This chart is what is driving Fed policy. They think real yields are too high and drag the economy. So, they have to cut rates to bring them down. Leave a Comment / Uncategorized / By inothernewsmedia
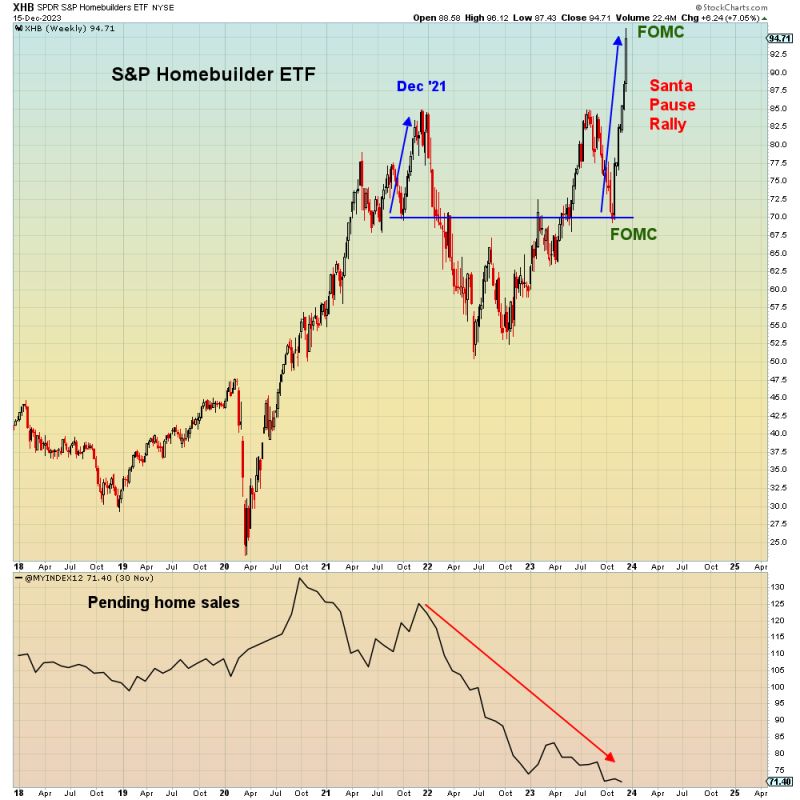
Intriguing dichotomy between US homebuilder #stocks (which are rallying) and Pending home sales (plunging). Can it last? Leave a Comment / Uncategorized / By inothernewsmedia
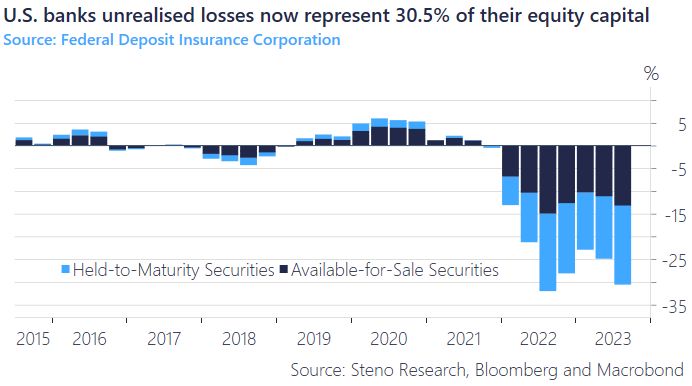
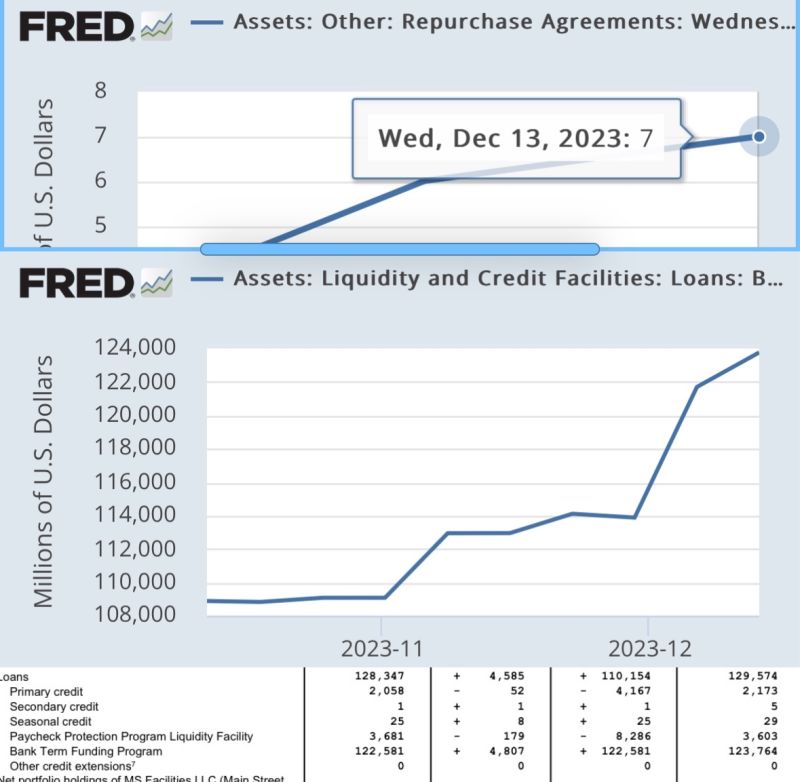
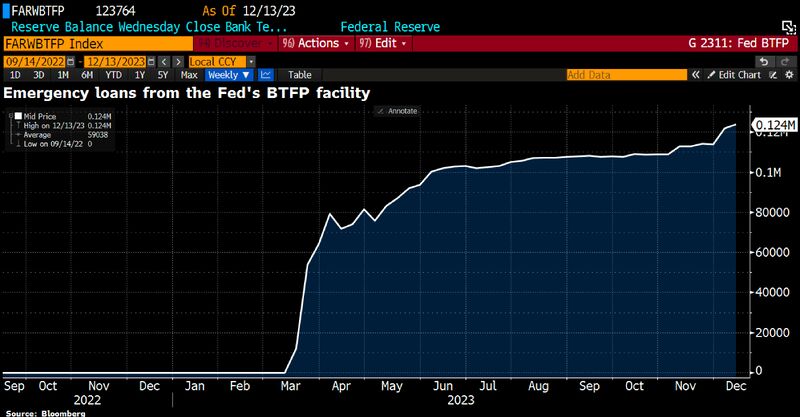
Interesting point highlighted by HolgerZ: It is striking that the #us #banks are continuing to obtain liquidity via the BTFP, even though long-term yields have fallen sharply. Is this the reason why #Fed chair Jerome Powell has suddenly communicated a pivot and announced #interestrate cuts? Source #chart: Bloomberg Leave a Comment / Uncategorized / By inothernewsmedia
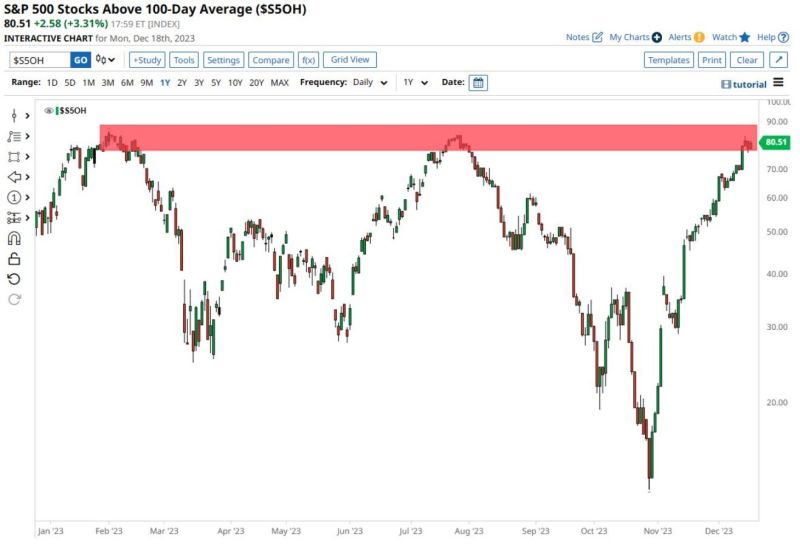
The #equity bull market is broadening. We are starting to see a broadening of market leadership emerge, especially as the notion of lower rates next year is embraced by investors. Over the past month, the Magnificent 7 stocks, which have led most of the year, were up just 1.5%, while the Russell 2000 small-cap index, a laggard in 2023, was up nearly 11%. Leave a Comment / Uncategorized / By inothernewsmedia
Bitcoin transaction fees just hit $37.14. The highest since the 2021 bull run to all time highs. Leave a Comment / Uncategorized / By inothernewsmedia
The net long positioning on the Nasdaq 100 by asset managers and leveraged funds is at a record high. When a trade becomes this crowded, how long until things reverse course? Leave a Comment / Uncategorized / By inothernewsmedia
While the #Fed and the #ECB are reducing their balance sheets and taking some #liquidity out of the market, the Chinese central bank (#PBoC) is pumping even more money into the market to stop the economic crash.Source: HolgerZ, Bloomberg Leave a Comment / Uncategorized / By inothernewsmedia
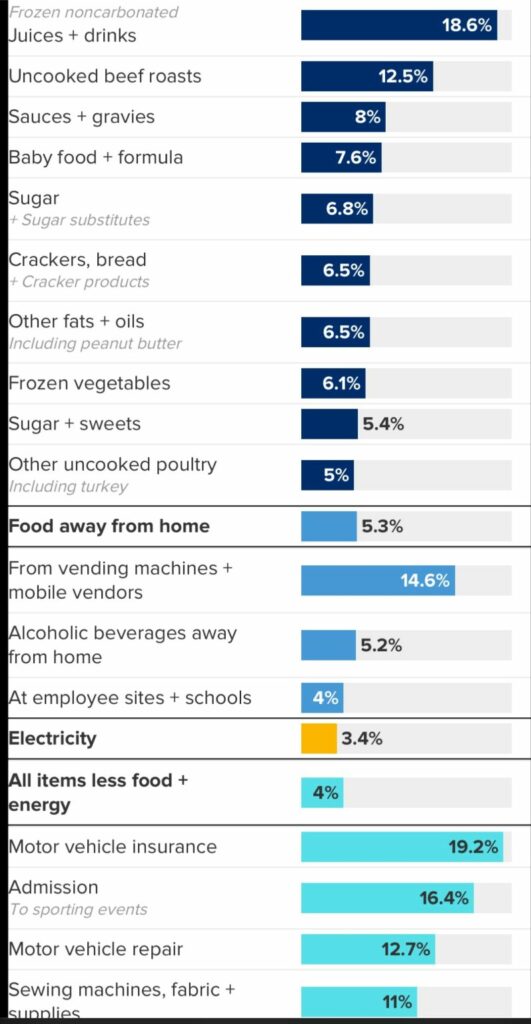
Biden, Krugman, Stiglitz and more recently Powell – Keynesian disinflation hoax: Prices continue to rise at a very high level, just a little more slowly than in recent months. Everyone pays the “special inflation tax” for the crazy monetary, financial, economic or debt policies and notices it every day at the cash register or at the gas pump … Leave a Comment / Uncategorized / By inothernewsmedia
This is likely the biggest #debt chart on earth, even though it has no actual debt in it! Yet it involves, by far, the biggest bond market on earth. Leave a Comment / Uncategorized / By inothernewsmedia
Over the last 120 years, 98% of countries where sovereign debt to GDP hit 130% end up defaulting Leave a Comment / Uncategorized / By inothernewsmedia